Perfinity

Filters

Sort by:
Categories
Categories
More
Business area
Sector of action
More
Manufacturers

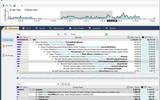
Debug, analyze and correct performance problems. 

The powerful line level display profile manager provides functionality to capture non-applicative performance data. In contrast to a classic .NET profile builder, our software allows the user to analyze processes with native code. Likewise, performance problems caused by native code can be identified, for example, from third-party libraries such as the .NET runtime.


Additionally, the tool offers event tracking support to maximize the user experience. File I/O activity, network activity, and debugging events can be captured. In this way, interesting insights about the application can be correlated with the line of time. Data context information can be added to investigate the internal part of applications at the code level. The integrated tempo line functionality enables the user to process interesting tempo intervals.

SpeedTrace Pro

en_US

Filters

Categories
Categories